Is duckworth Lewis worth it?
This project was created because I was curious as to how accurate duckworth lewis stern (DLS) actually is (mostly due to South Africa getting the short end of this stick a couple of times). The project link can be found here
I started off trying to do this using cricinfo’s Statsguru, maybe I didn’t know how, but it did not seem possible to do so. So I created this project with the following aim:
Calculate the accuracy of DLS at different point of a chasing ODI innings. To do this I would need to get ball by ball data, process that data into useable format, calculate DLS at different points of the 2nd innings of each match, see if the current total is bigger or smaller than the DLS par score, compare that to the team that actually won the match and finally see how often DLS got it right.
Warning small rant:
It turns out that the actual calculations used for DLS at the top level is not made public for whatever reason, Which to me is a bit weird. I am not saying it is for nefarious reasons, but I can forsee a situation where DLS can be tweaked to advantage certain teams, e.g teams with higher run rate at the end of games, or teams who bat deep, etc. It would in my opinion be in the interest of all cricket fans if DLS was transparent.
This version of DLS was used up to 2004, after which sercret ICC methods were used. I would assume that any newer methods would be more accurate, keep that in mind when interpreting the results.
Getting the data
I realised that cricinfo is stingy with providing ball by ball data, so I found cricsheet. They provide ball by ball match data in .yaml format, which is exactly what I needed. So I fetched all the matches and saved it in a local directory. My project repo readme provides instructions for anyone that wants to do the same. The data inlcudes smaller nations ODI’s like Nepal.
Processing the data
To get the data into a useable format, I had to do a lot of processing. I processed the .yaml files into one large dataframe, after which I could do some calculations. For each ball in the 2nd innings I then calculated the DLS par score and compared that to the actual 1st innings total, after which I could group all the data together into each over of the 2nd innings, where I counted the number of times the dls was correct and divided that by the total number of instaces to get the accuracy.
Results
In the end the data contained a total of 1722 male ODI’s with the earliest match being start of 2004. Only matches where there were no overs missed in the game was considered to avoid complicating the DLS calculations. The results can be seen in the following graph:
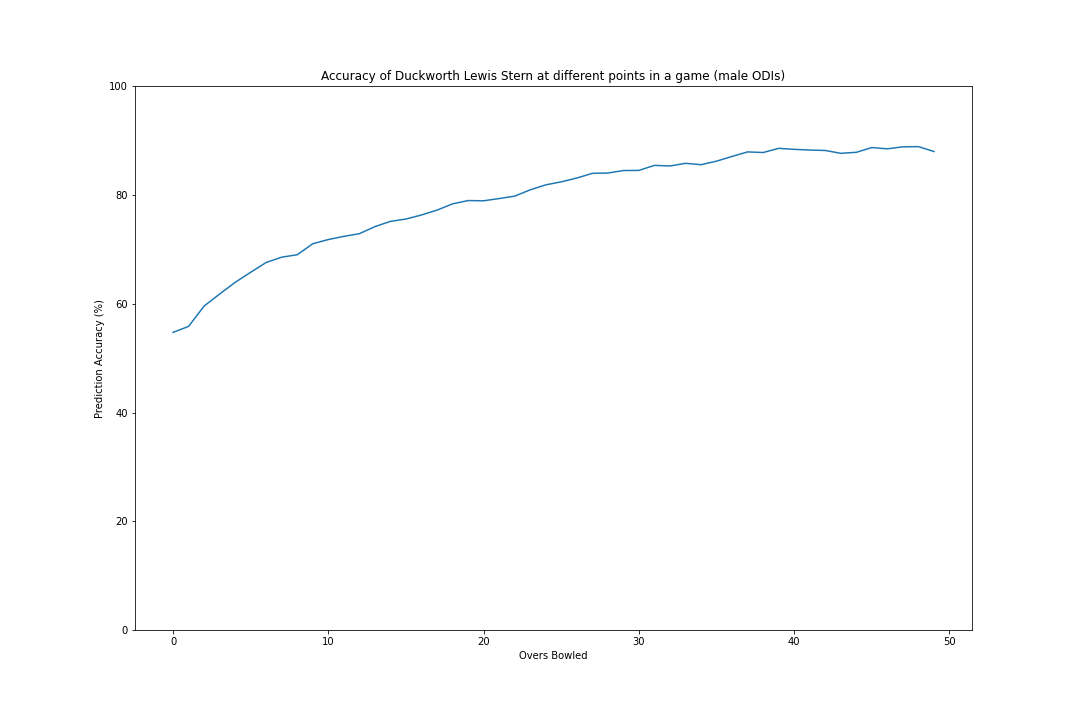
The DLS accuracy increases steadily as the number of overs bowled increases. This demonstrates also why DLS is only used when a minimum of 20 overs has been bowled, to avoid the decreased accuracy at the start of the innings. Towards the end of the innings the accuracy approaches 90% and stays fairly constant from over 38 onwards. It would be interesting to see whether the accuracy of DLS changes when the team is aware of the DLS target and there is a threat of rain. Obviously this is difficult to get from this data and would probably require manually checking where this happened.
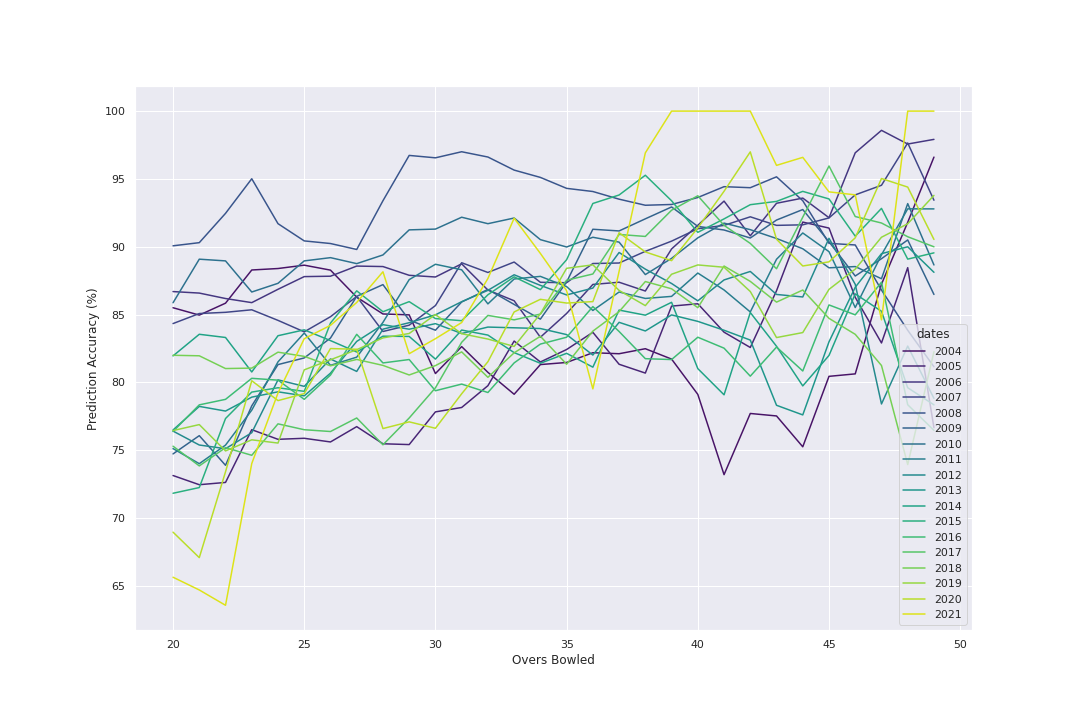
DLS by year
I thought it would be interesting to see how well DLS perfromed each year since 2004. I thought the newer way of playing cricket with the changes in rules might make it less accurate over time, but from this graph this was not seen to clearly be the case
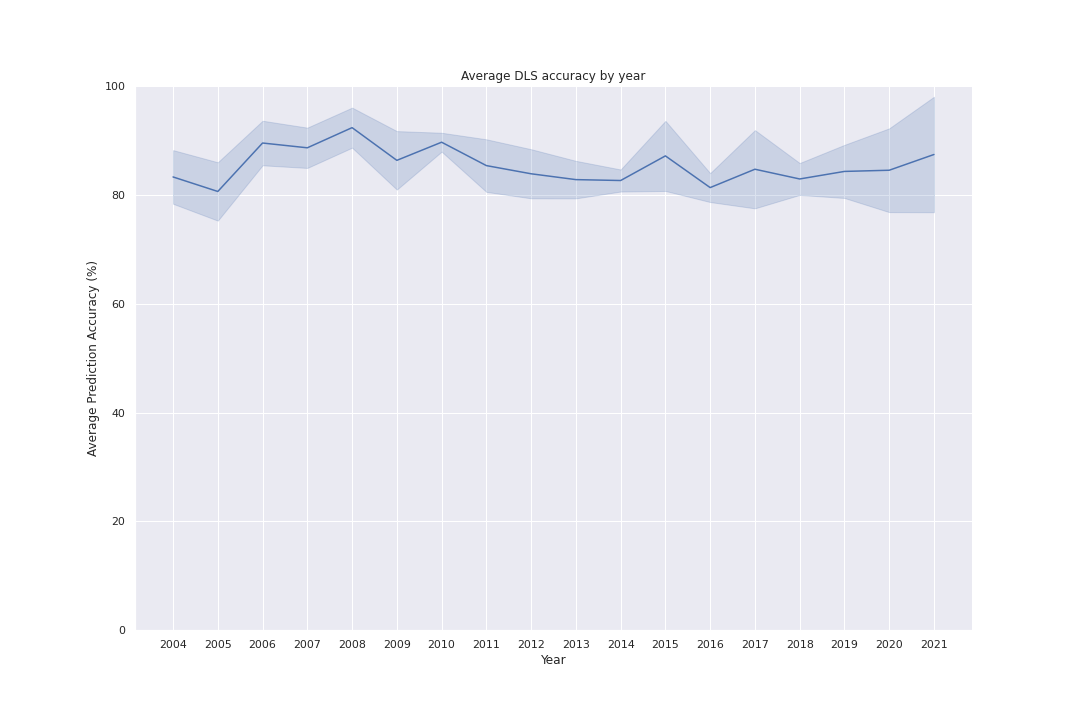
 To confirm this I drew the average accuracy accross all overs after over 20 for each year. This also confirms no decrease in DLS accuracy over time.
todo
do the same for t20’s and compare to ODI’s see if a simple ML model can beat this compare accross countries